-

- Sopto Home
-

- Special Topic
-
- Twinax Cable Knowledge
-
- Sopto Cable Testing Results Explained
Twinax Cable Knowledge
- Cable Labeling as Part of Data Center Management
- How to Correctly Run cables On Servers in a Data Center?
- 4 Realities You Should Consider 10G Ethernet for Your Business
- Is it finally the end of copper?
- Why We Need Both 40G and 100G Ethernet Cable?
- What is Twisted Pair Cable?
- Benefits of Twisted Pair Cable Construction
- Why Copper Is Used in Cables?
- A Brief Look at Ethernet Cable Construction
SOPTO Special Topic
Certificate
Guarantee
Except products belongs to Bargain Shop section, all products are warranted by SOPTO only to purchasers for resale or for use in business or original equipment manufacturer, against defects in workmanship or materials under normal use (consumables, normal tear and wear excluded) for one year after date of purchase from SOPTO, unless otherwise stated...
Return Policies
Defective products will be accepted for exchange, at our discretion, within 14 days from receipt. Buyer might be requested to return the defective products to SOPTO for verification or authorized service location, as SOPTO designated, shipping costs prepaid. .....
Applications
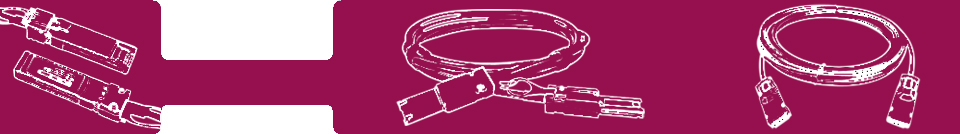
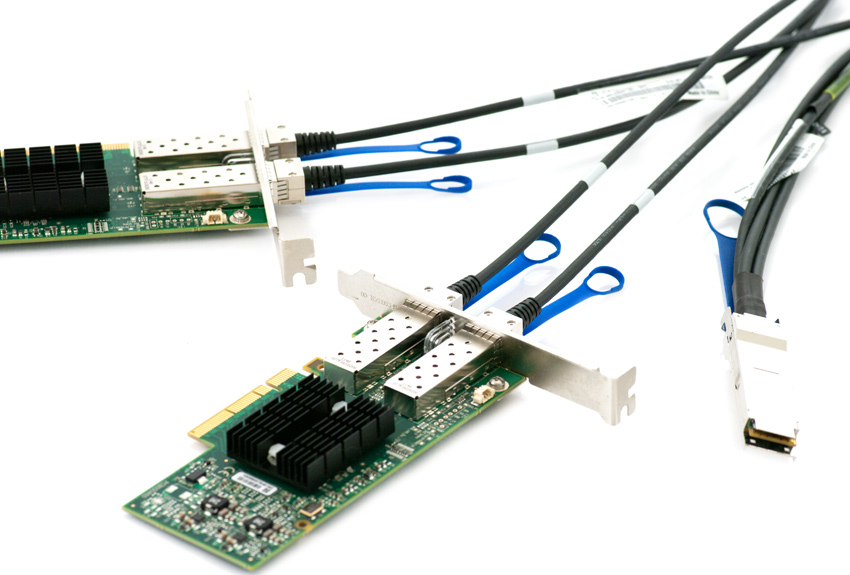 Twinax Cables are mainly used with PCI or PCI-E Card for the short distance interconnection in the server room.
SNS Page


SOPTO Products
- Fiber Optic Transceiver Module
- High Speed Cable
- Fiber Optical Cable
- Fiber Optical Patch Cords
- Splitter CWDM DWDM
- PON Solution
- FTTH Box ODF Closure
- PCI-E Network Card
- Network Cables
- Fiber Optical Adapter
- Fiber Optical Attenuator
- Fiber Media Converter
- PDH Multiplexers
- Protocol Converter
- Digital Video Multiplexer
- Fiber Optical Tools
- Compatible
Related Products
Performance Feature
Stable Transmission Speed
Reliable Transmission
Various Length Selection
Wider Operating Temperature
Good for HPC
Good for Data Center
Twinax Cable Knowledge
Recommended
Sopto Cable Testing Results Explained
To better understand the results of your cable test report, please review the information below. We will explain the specifications as well as the most significant test results categories.
We use the Fluke DTX-1800 Cable Tester and the Fluke LinkWare Software. The Fluke tester supports two sets of specifications for Cat5e and CAT6 patch cords: the TIA and ISO specs. The ISO spec tends to be stricter than TIA.
Each cable will have its own individual test result.
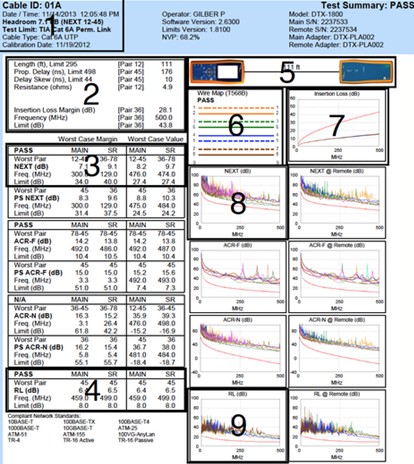
Cat 6A UTP Cable Test Result
1. Test Limit
The significance of this result category is the test limit values, from which the Pass/Fail and frequency ranges are measured. Below is the standard for the TIA Permanent Link.
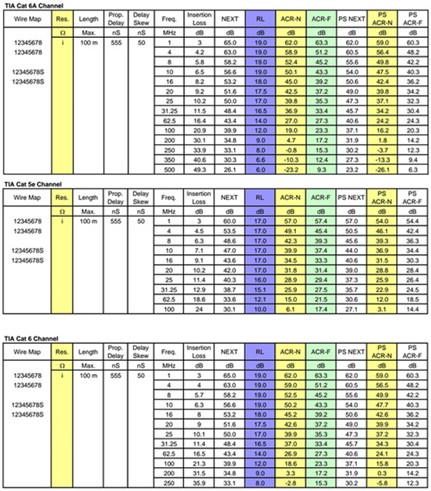
Standard for the TIA Permanent Link
2. Length, Delay, Resistance, and Insertion Loss
This parameter shows the tester's estimate of the Length of the cable (which may not be the same as the actual length, the length is based on electrical delay), the Propagation Delay (how long for the signal to be sent from one end to the other measured in nanoseconds), Delay Skew (testing the largest difference in propagation delay from one pair to another measured in nanoseconds), Resistance (measuring the total ohms through one wire pair looped at one end of the connection), Insertion Loss Margin (comparing the insertion loss with the TIA standard).
3. Near-End Crosstalk (NEXT)
The table shows the worst near-end crosstalk (NEXT) result in the cable. Crosstalk is the tendency of the signals on one of the data pairs to induce signal on another data pair. The values show that both main (MAIN) and remote (SR) tester units were tested. Worst Pair shows which set of pairs has the worst crosstalk. NEXT (dB) shows the value of the worst pair compared with the testing limit. Freq. (MHz) shows the frequency at the worst NEXT margin and value. Limit (dB) shows the limit value in dB at the frequency shown.
4. Return Loss (RL)
This test parameter identifies the worst pair in the cable for return loss performance. Same as the Near-End Crosstalk, the Worst Pair shows which set of pairs has the worst return loss performance compared with the testing limit. RL (dB) shows the value of the worst pair under the return loss testing limit. Freq. (MHz) shows the frequency at the worst RL margin and value. Limit (dB) shows the limit value in dB at the frequency shown.
5. Estimate of Length
This is an estimate of the cable length based on the time it took signal to travel through it. This should be fairly close to the physical cable length but it may differ.
6. Wiremap
The wiremap test is used to confirm that each wire is hooked up correctly, with no opens or shorts. Also showing the physical errors like crossed pairs, reversed pairs or split pairs.
7. Insertion Loss Graph
The red trace shows the testing limits for the insertion loss. This is the only graph where we would want to have our values below the red trace which mean less insertion loss is less than the TIA/ISO limit standard.
8. NEXT Graph
Again, the red trace shows the testing limits for Near-End Crosstalk. The mixed colored traces show the six pairs combinations. The larger the value, the better the result. As long as the pairs' results fall above the PASS/FAIL line (red trace), the cable passed the specification.
9. RL Graph
For the RL graph and similar to the NEXT graph, the larger the value the better the result. As long as the traces for the pair combinations (4 pairs) fall above the PASS/FAIL line (red trace), the cable passed the specification. To know more high speed twinax cables information, please contact a Sopto representative by calling 86-755-36946668, or by sending an email to info@sopto.com